What is ROC Curve?
The ROC Curve (Receiver Operating Characteristic Curve) is a graphical representation used to evaluate the performance of a binary classification model. It depicts the trade-off between the true positive rate (TPR) and the false positive rate (FPR) at various threshold settings, providing insights into a model’s ability to distinguish between classes.
How does the ROC Curve operate or function?
The ROC Curve functions by visualizing the performance of a classification model across different threshold values. Here’s a breakdown of its key aspects:
- True Positive Rate (TPR):
- Measures the proportion of actual positives correctly classified by the model.
- Also known as sensitivity or recall.
- Formula: TPR=TruePositivesTruePositives+FalseNegativesTPR = \frac{True Positives}{True Positives + False Negatives}TPR=TruePositives+FalseNegativesTruePositives.
- False Positive Rate (FPR):
- Indicates the proportion of actual negatives incorrectly classified as positives.
- Formula: FPR=FalsePositivesFalsePositives+TrueNegativesFPR = \frac{False Positives}{False Positives + True Negatives}FPR=FalsePositives+TrueNegativesFalsePositives.
- Threshold Adjustment:
- By varying the decision threshold, the classifier’s predictions change, leading to different TPR and FPR values.
- ROC Curve Plot:
- Plots TPR (y-axis) against FPR (x-axis) for all thresholds, resulting in the ROC curve.
- Area Under the Curve (AUC):
- A single metric summarizing the ROC Curve.
- AUC values close to 1.0 indicate a highly effective model, while values near 0.5 suggest a model with no discriminative power.
- Trade-offs:
- The ROC Curve highlights the trade-offs between sensitivity (recall) and specificity, helping to choose the optimal classification threshold based on the application.
Common Uses and Applications of ROC Curve
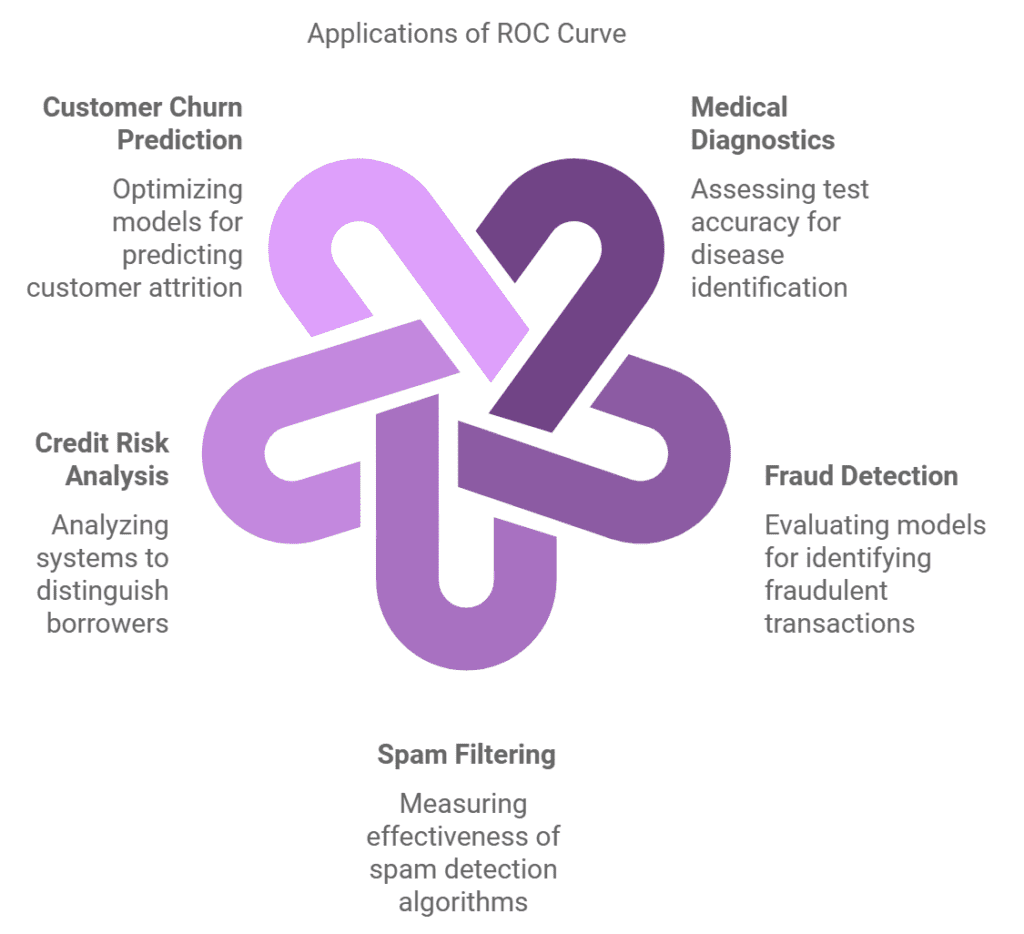
The ROC Curve is widely used in binary classification tasks to evaluate model performance. Here are some of its key applications:

- Medical Diagnostics: Assessing the accuracy of tests for identifying diseases (e.g., cancer detection).
- Fraud Detection: Evaluating models used to identify fraudulent financial transactions.
- Spam Filtering: Measuring the effectiveness of spam detection algorithms.
- Credit Risk Analysis: Analyzing credit scoring systems to distinguish between good and bad borrowers.
- Customer Churn Prediction: Optimizing models that predict customer attrition for retention strategies.
Advantages and Benefits of Using the ROC Curve
- Model Performance Evaluation:
- Provides a visual representation of a model’s ability to distinguish between classes.
- Threshold Flexibility:
- Allows evaluation of model training and performance across a range of thresholds.
- Robust Comparison Tool:
- Facilitates comparison of multiple models, regardless of class imbalance.
- Single Metric Summary:
- The AUC condenses performance into one interpretable number, simplifying analysis.
- Useful for Imbalanced Datasets:
- Unlike accuracy, the ROC Curve provides insights into performance in datasets with uneven class distributions.
Drawbacks or Limitations of the ROC Curve
While the ROC Curve is powerful, it has certain limitations:
- Imbalanced Classes:
- Can give misleading results in datasets with highly imbalanced classes; a Precision-Recall Curve may be more insightful in such cases.
- Focus on Relative Performance:
- It doesn’t provide absolute measures of error or misclassification costs.
- Threshold Insensitivity:
- While it evaluates performance across thresholds, it doesn’t provide insights into specific thresholds for decision-making.
Real-Life Examples of ROC Curve in Action
- Healthcare:
- A hospital uses the ROC Curve to evaluate a diagnostic test for diabetes. By analyzing sensitivity and specificity, they determine the threshold that best balances the risk of misdiagnosis.
- Finance:
- A credit card company applies ROC analysis to optimize a fraud detection system, reducing false alarms while maintaining high detection rates.
- E-Commerce:
- An online retailer evaluates their customer churn prediction model, using the ROC Curve to fine-tune marketing strategies.
Comparison to Similar Concepts or Technologies
- ROC Curve vs. Precision-Recall Curve:
- The ROC Curve evaluates overall classification performance across thresholds.
- The Precision-Recall Curve focuses on the positive class, making it more useful for imbalanced datasets.
- Accuracy vs. ROC Curve:
- Accuracy measures overall correctness but may fail to account for imbalanced data.
- The ROC Curve provides a more nuanced view of performance.
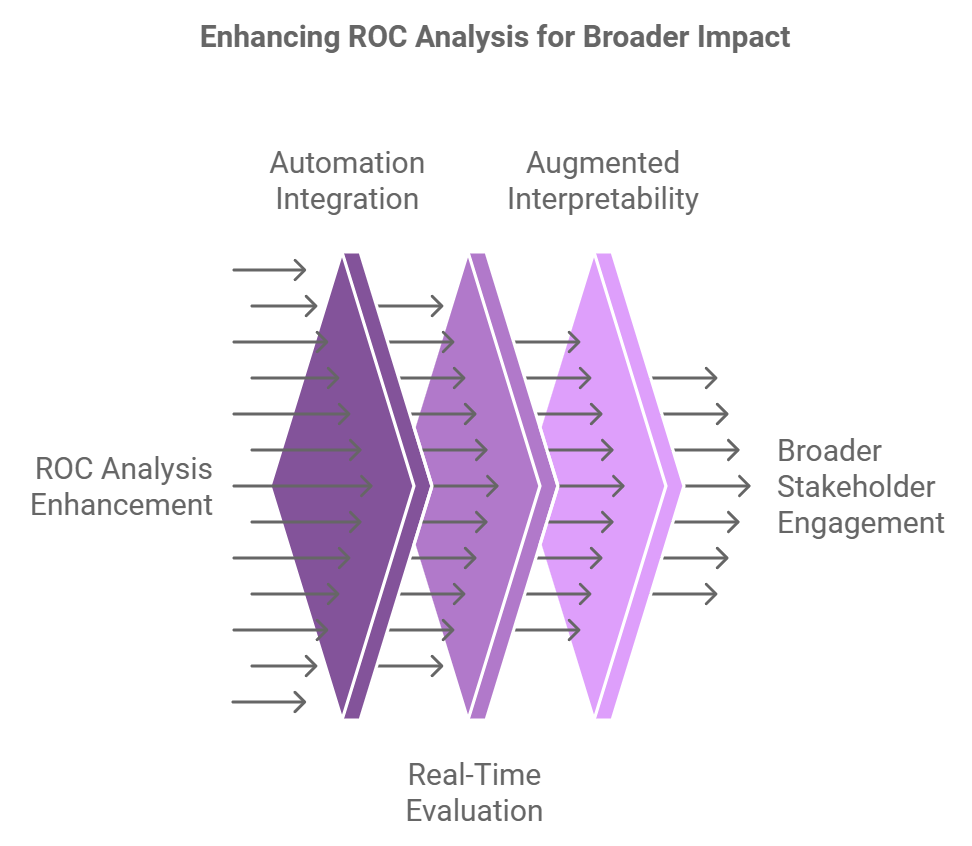
Expected Future Trends for ROC Curve

- Integration with Automation:
- Automated tools will enhance ROC analysis for large-scale models, reducing manual intervention.
- Real-Time Evaluation:
- Advanced ROC tools will enable real-time monitoring of model performance in dynamic environments.
- Augmented Interpretability:
- Improved visualization and explanation techniques will make ROC analysis more accessible to non-technical stakeholders.
Best Practices for Using ROC Curve Effectively
- Combine Metrics:
- Use the ROC Curve alongside metrics like precision, recall, and F1-score for comprehensive evaluation.
- Consider Application Context:
- Balance trade-offs between sensitivity and specificity based on your specific application.
- Account for Imbalanced Classes:
- Complement ROC analysis with precision-recall curves in datasets with uneven class distributions.
Step-by-Step Instructions for Implementing ROC Curve
- Prepare Data:
- Split your dataset into training and testing sets.
- Train the Model:
- Fit your classification model using the training set.
- Generate Predictions:
- Obtain predicted probabilities for the test set.
- Calculate Metrics:
- Compute TPR and FPR at various thresholds.
- Plot the ROC Curve:
- Use tools like Python’s
matplotliborscikit-learnto visualize the curve.
- Use tools like Python’s
- Compute AUC:
- Summarize the curve’s performance using the AUC metric.
Frequently Asked Questions
Q: What is the purpose of the ROC Curve?
A: The ROC Curve evaluates the trade-offs between sensitivity and specificity in a classification model, helping to identify its optimal threshold.
Q: What does AUC signify?
A: The Area Under the Curve (AUC) quantifies the model’s overall performance; higher values indicate better discrimination between classes.
Q: How does the ROC Curve handle imbalanced datasets?
A: While informative, the ROC Curve can be misleading in imbalanced datasets. The Precision-Recall Curve is often more appropriate in such scenarios.
Q: What tools can generate ROC Curves?
A: Libraries like scikit-learn in Python provide functions to compute and plot ROC Curves.
Q: Can the ROC Curve be used for multi-class classification?
A: Yes, by using one-vs-rest or one-vs-one strategies, the ROC Curve can evaluate multi-class models.


