What is Area under the Curve?
The Area under the Curve (AUC) is a performance metric that measures the ability of a model to distinguish between classes. It quantifies the overall accuracy of a classification model, with higher values indicating better performance.
How does the Area Under the Curve (AUC) Operate or Function?
The Area Under the Curve (AUC) is a crucial metric in evaluating the performance of machine learning models, especially in classification tasks. It quantifies the model’s ability to distinguish between classes by measuring the area under the Receiver Operating Characteristic (ROC) curve, which plots the true positive rate against the false positive rate at various threshold settings. Here’s how AUC operates:
- Threshold Variability: AUC considers multiple thresholds, providing a comprehensive view of model performance.
- Interpretation: AUC ranges from 0 to 1. An AUC of 0.5 indicates no discrimination (random guessing), while 1.0 indicates perfect discrimination.
- Model Comparison: AUC is useful for comparing different models; the higher the AUC, the better the model performs in distinguishing classes.
- Robustness: AUC is less sensitive to class imbalance compared to accuracy, making it a reliable metric in many real-world scenarios.
- Insights from Analysis: AUC helps in understanding the trade-offs between sensitivity and specificity, guiding decisions on the optimal threshold for deployment.
Common Uses and Applications of AUC
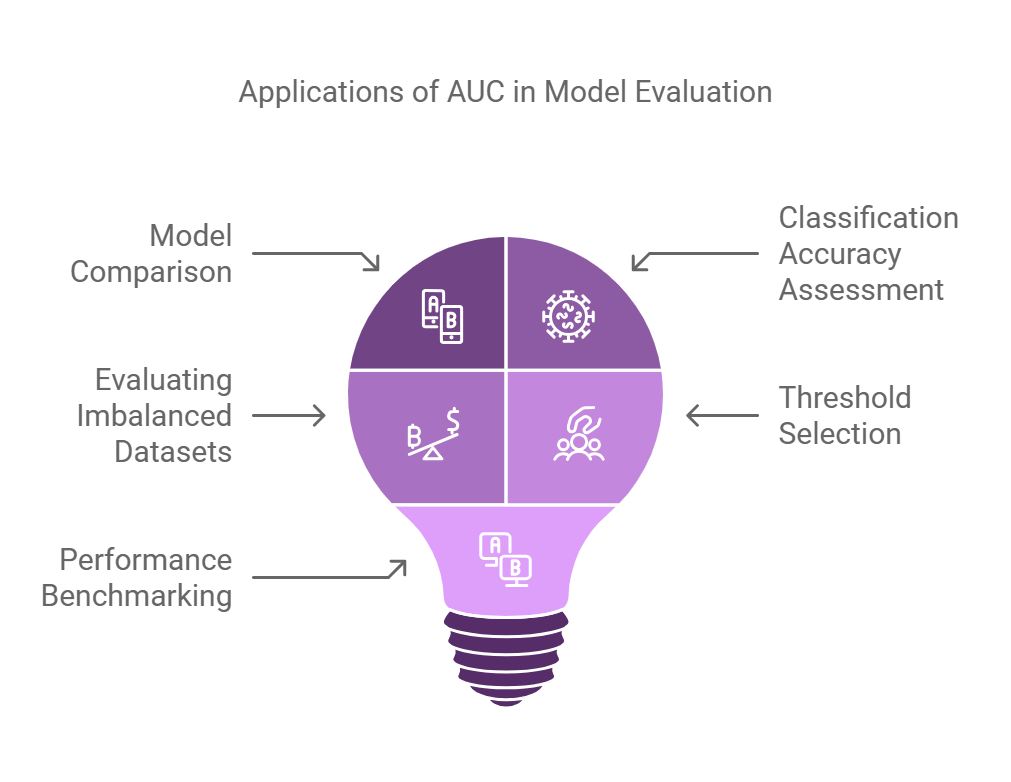
AUC is a critical metric in evaluating model performance, particularly in binary classification tasks. It provides a single scalar value summarizing model performance across all classification thresholds. Here are some key applications of AUC in real-world scenarios:
- Model Comparison: AUC allows data scientists to compare different models based on their performance, helping to select the best model for specific tasks.
- Classification Accuracy Assessment: It quantifies how well a model distinguishes between classes, making it vital for applications like medical diagnostics where accurate classification is essential.
- Evaluating Imbalanced Datasets: AUC is particularly useful when dealing with imbalanced datasets, focusing on the ranking of predictions rather than the absolute number of correct classifications.
- Threshold Selection: By analyzing the AUC curve, practitioners can determine the optimal threshold for classifying positive and negative instances, improving decision-making processes.
- Performance Benchmarking: AUC serves as a benchmark for model performance, enabling consistent evaluation across different machine learning projects.
What are the Advantages of AUC?
The Area Under the Curve (AUC) provides a comprehensive measure of model performance. Here are the key benefits of using AUC:
- Model Performance: AUC quantifies the ability of a model to distinguish between classes, providing a clear metric for comparison.
- Threshold Independence: AUC evaluates model performance over all possible classification thresholds, making it more reliable than accuracy alone.
- Robustness: AUC is less affected by imbalanced datasets, allowing for better evaluation in real-world scenarios.
- Insightful Visualization: The AUC curve provides visual insights into model performance, aiding in diagnosis and improvements.
- Comprehensive Evaluation: It integrates both the True Positive Rate and False Positive Rate, offering a holistic view of model efficacy.
- Standardized Metric: AUC is widely accepted in the industry, facilitating easy communication of model performance across teams and stakeholders.
What are the Drawbacks or Limitations of AUC?
While AUC has numerous benefits, it also comes with some limitations:
- AUC might not provide a complete picture of model performance, especially in imbalanced datasets.
- It does not account for the costs associated with false positives and false negatives.
- AUC can be misleading if the model is evaluated over a limited range of thresholds.
These challenges can impact the reliability of model evaluation and decision-making.
What are some Real-Life Examples of AUC in Action?
AUC is used by healthcare companies to predict patient outcomes based on diagnostic tests. For example, in one case study, a hospital utilized AUC to evaluate a machine learning model predicting disease progression. This demonstrates how AUC helps assess a model’s accuracy and reliability in critical healthcare decisions.
How does AUC Compare to Similar Concepts or Technologies?
Compared to accuracy, AUC evaluates the true positive rate against the false positive rate across different thresholds. While accuracy focuses solely on the proportion of correct predictions, AUC provides a more nuanced understanding of model performance, particularly in cases of imbalanced classes.
What are the Future Trends for AUC?
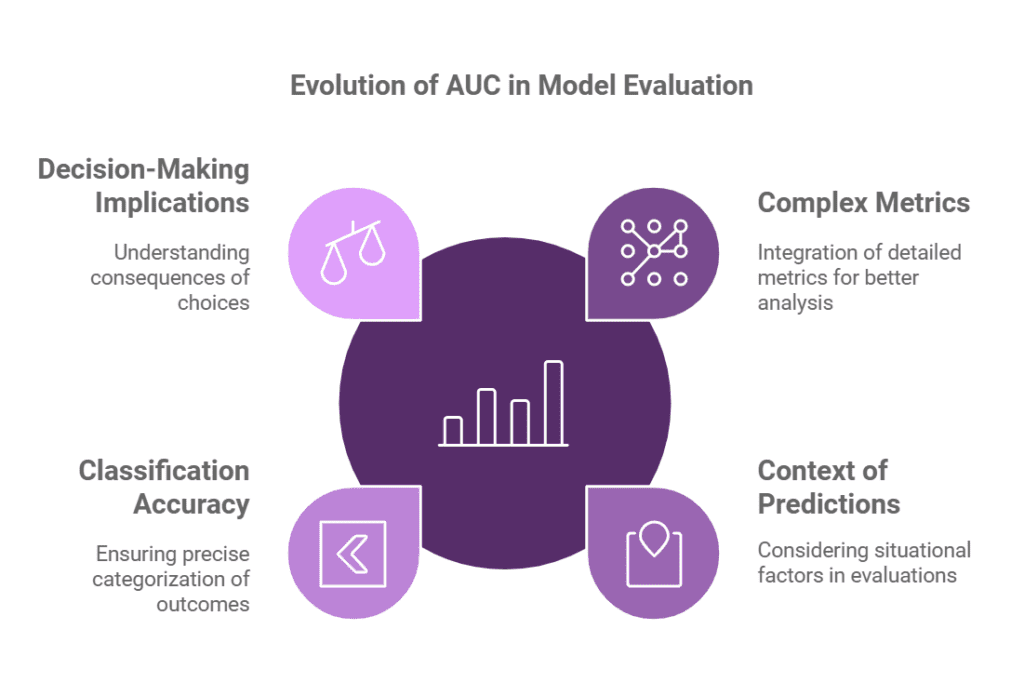
In the future, AUC is expected to evolve by integrating more complex metrics that account for the context of predictions. These changes could lead to improved model evaluation techniques that consider not only classification accuracy but also the implications of decision-making in various fields.
What are the Best Practices for Using AUC Effectively?
To use AUC effectively, it is recommended to:
- Analyze AUC in conjunction with other metrics like precision and recall.
- Ensure robust validation techniques to minimize bias.
- Consider the distribution of classes in the dataset.
Following these guidelines ensures a more comprehensive evaluation of model performance.
Case Studies Demonstrating AUC Implementation
One notable case study involved a financial institution that used AUC to evaluate credit scoring models. By analyzing the AUC, they achieved a 20% increase in identifying high-risk borrowers, significantly reducing default rates. This highlights the practical benefits of AUC in enhancing decision-making processes.
What are the Related Terms for Understanding AUC?
Related terms include the Receiver Operating Characteristic (ROC) curve and the Precision-Recall curve. These are crucial for understanding AUC as they provide context for interpreting the AUC value and understanding trade-offs between sensitivity and specificity.
What are the Step-by-step Instructions for Implementing AUC?
To implement AUC, follow these steps:
- Prepare your dataset and split it into training and testing sets.
- Train your model using the training data.
- Generate predicted probabilities for the test set.
- Plot the ROC curve and calculate the AUC value.
- Interpret the AUC value and use it for model evaluation.
These steps ensure a systematic approach to evaluating model performance.
Frequently Asked Questions
What Does AUC Represent in Model Evaluation?
AUC measures the ability of a model to distinguish between classes.
- AUC values range from 0 to 1.
- A higher AUC indicates better model performance.
How Is AUC Calculated?
AUC is derived from the Receiver Operating Characteristic (ROC) curve.
- It quantifies the area under the ROC curve.
- This represents the trade-off between true positive rate and false positive rate.
Why Is AUC Important for Evaluating Machine Learning Models?
AUC provides a single metric for model performance.
- It is not affected by class imbalance.
- It allows for easy comparison between different models.
What AUC Value Indicates a Good Model?
An AUC value above 0.7 is generally considered acceptable.
- Values above 0.8 indicate good performance.
- Values approaching 1.0 suggest excellent model accuracy.
Can AUC Be Used for Multi-Class Classification?
Yes, AUC can be extended to multi-class problems.
- This is done using one-vs-all or one-vs-one approaches.
- It helps in evaluating performance across multiple classes.
What Are Some Limitations of AUC?
AUC may not provide a complete picture of model performance.
- It does not account for the cost of false positives vs. false negatives.
- It can be misleading if the ROC curve is not well-defined.
How Can AUC Be Visualized?
AUC is visualized using the ROC curve.
- The curve plots the true positive rate against the false positive rate.
- The area under the curve represents the AUC value.


